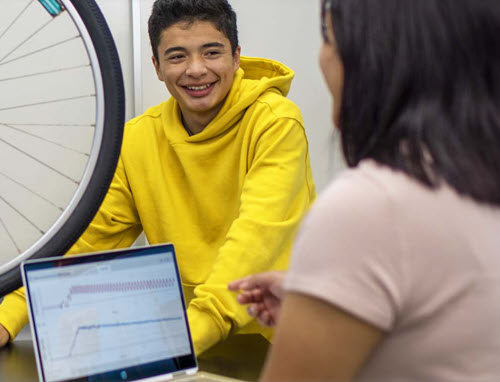
BEAVERTON, Oregon — Vernier Science Education has updated Vernier Graphical Analysis ® Pro to further meet the needs of high school and college educators and students. This award-winning app, which helps students engage in advanced data analysis as they think critically and make real-world connections, now includes even more features to deepen and extend learning—including an annotation feature, which enables students to comment on a region or point of a graph.
“Technology, such as our newly updated Graphical Analysis Pro app, can support students in building STEM literacy and forming critical connections between abstract scientific ideas and the real world,” said John Wheeler, CEO of Vernier Science Education. “With Graphical Analysis Pro, students can visualize and interact with experiment data they have collected via nearly 50 of our sensors. At the same time, educators can use the app to enrich their live instruction and provide even more opportunities for students to interact with and analyze data outside of the classroom or lab.”
Graphical Analysis Pro lets educators and students easily view and sync a video to sensor data, which enables them to replay, speed up, slow down, and pause recorded experiments at key moments in time. Whether learning happens remotely or in person, students can perform live experiments and share data over the internet in real time as they analyze and graph data and experience three-dimensional learning.
With the new annotation feature, students can leave comments on a region or point of a graph in the app. Educators can use this feature to have students demonstrate their understanding of graphs and to show they know how the story of a graph corresponds to what happened in the real world.
Additional app enhancements, which are based on educator feedback, include the following:
- The ability to strike through unwanted data
- New functions in custom calculated columns
- The option to display uncertainty of curve fit parameters
- Adjustable number of points used in derivative calculations
- Additional graph types, including bar graphs, histograms, and Fast Fourier Transforms
- The ability for custom curve fit expressions to be entered by the user
- The ability to add error bars to graphs so that students can convey the uncertainty of measurements
- The ability to plot categorical data
- The ability to highlight important events with one click, such as noting the moment a sample starts to melt using the Go Direct® Melt Station
Graphical Analysis Pro also includes a wide variety of ready-to-analyze experiment videos synced with sample data and complete student instructions. These experiment videos cover common topics in biology, chemistry, and physics. Additionally, the app is compatible with most devices used in schools, including Chromebooks™, providing flexibility and cost savings, as students can use their own devices for analysis while learning in the classroom, in the field, and at home.
To learn more about Graphical Analysis Pro, visit www.vernier.com/gapro.
About Vernier Science Education
For more than 40 years, Vernier Science Education has been committed to using our experience, knowledge, and passion to create the best and most reliable solutions for STEM education. Our comprehensive solutions include hardware, software, content, assessment, professional development, and technical support. At the heart of Vernier is our deep commitment to being an authentic and trusted partner to STEM educators. We are dedicated to partnering with educators and communities to build a STEM-literate society where students grow up to become knowledgeable citizens who can solve problems, fully contribute to their communities, and drive innovation. For more information, visit www.vernier.com.
- Demco Acquires StickTogether, Accelerating StickTogether’s Mission and Expanding Demco’s Range of Innovative Solutions - April 16, 2024
- EPS Learning Programs Selected by Virginia Board of Education as Recommended Literacy Solutions - April 15, 2024
- Vernier Science Education Selects 10 Inspiring STEM Teachers to Join Its New Vernier Trendsetters Community - April 12, 2024

